


ACOUSTICS: BUILDING A SOUND KNOWLEDGE Part 2
In Part 1 we looked at why sound is important, how we measure Sound Pressure and level, and how we measure Frequency, which describes the variation in sound pressure. In this second part we look at the remaining two important ways of measuring sound, Sound Sources and Sound Power.

How the human ear hears frequencies
While the frequency spectrum is a well-defined physical measure of a sound, it doesn’t tell us anything about how humans experience sound. Research shows that different frequencies are experienced by the human ear differently in terms of loudness – so a low frequency sound is experienced at a lower level than a high frequency sound at the same sound pressure level.
This is due to the natural attenuation and resonance of the human ear. Resonance occurs around 2 – 4kHz, the range where speech intelligibility for humans lies. The frequency response of ears varies from species to species – so the small ear of a mouse is more adapted to hear high frequency squeaks.
To account for this, we use a frequency weighting filter, which for humans is called A-weighting, which is shown by the red line in Fig. 1. Here we can see that the sound pressure level in the 63Hz band is reduced by 26dB and the sound pressure level in the 2,000Hz band is increased by 1dB. Therefore, human hearing is not very sensitive to low frequency sound.
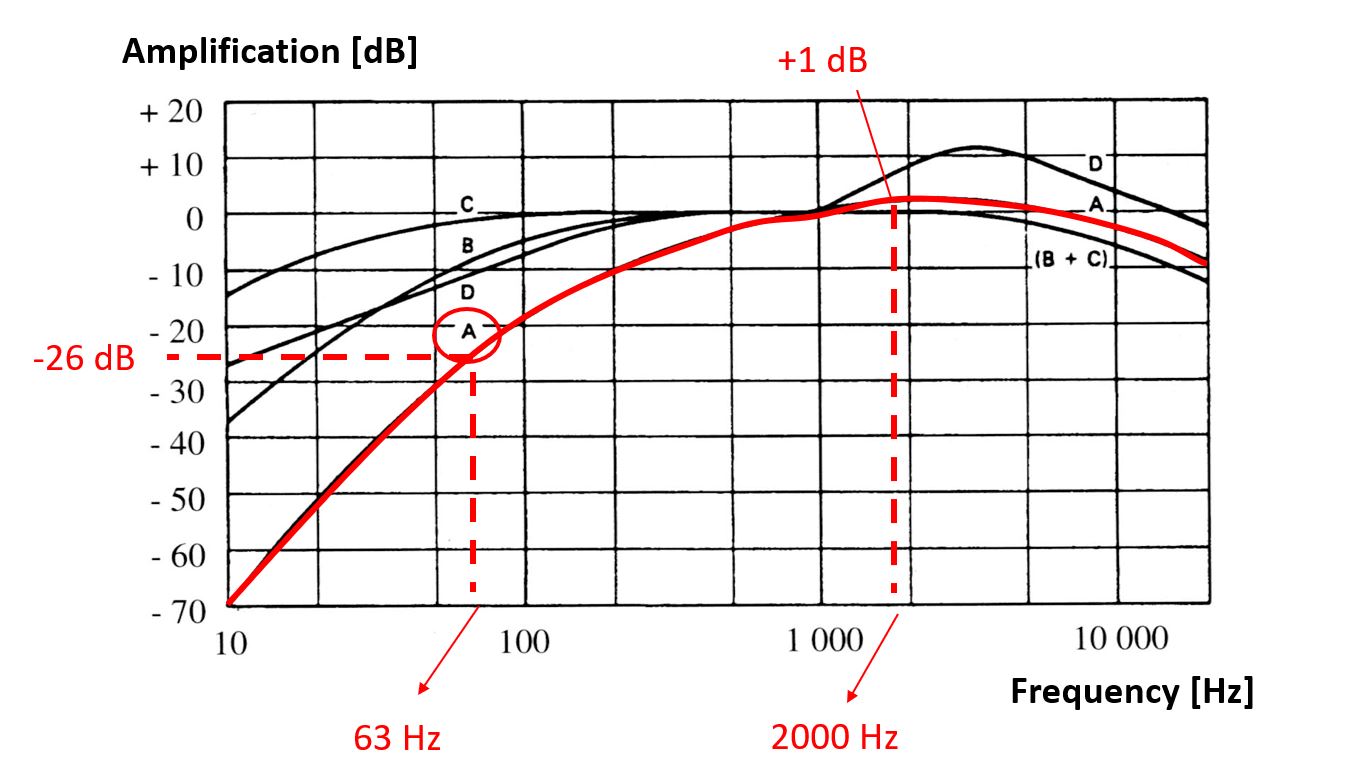
Fig.1 Illustration of effects of A-weighting
To work out the total A-weighted sound pressure level, we need to include the weighting factors of each band.
The A-weighting is defined as having 0dB of correction at 1000Hz. When we specify that a decibel figure has been A-weighted, it is denoted as dB(A).
Sound Sources and Sound Power
The next step is to understand exactly where a sound comes from – the sound source. This is defined as the object where the sound is actually generated, not where it might be amplified or attenuated. The sound source creates vibrations, pushing outwards at the speed of sound, forming the sound wave. In HVAC systems, common sound sources are the fan or a damper.
The sound power generated at a sound source is different from the sound pressure we measure. When we measure the sound pressure in a space, all sorts of other factors come into play: the sound absorption of the room, the size of the space, any background noise and so on. So we use a different measure to define the sound energy coming only from the sound source: Sound Power.
The formula for defining Sound Power is:
Lw = 10 log (W/W0) = 10 log (W/10-12)
Where Lw is the Sound Power level in dB, W is the Sound power in Watts, and W0 is the reference value (see below).
As when we measure sound pressure, we use a reference value when defining the sound power, and that is 10-12 W. As with sound pressure, sound power can be defined for each octave band, with the sum of these called the Total Sound Power Level. If the A-weighting filter is used, we obtain the total A-weighted Sound Power Level in the same way.
Adding Sound Sources
If there are more than one sound source, defining their combined sound level is not as simple as adding the two dB figures together. In essence, if one sound source is much stronger than the other, the additional sound level created by the two will not be much (if any) more than that created by the stronger sound source.
Only when the difference between the two sound sources is small will there be an increase in sound level; if the difference is more than 10dB, then the increase is very small increase when compared to the stronger sound source.
If you think about it, if you are in a room with loud music playing, someone talking at normal volume will not increase the overall level of noise in the room. But two or more people speaking at normal volume will sound louder than just one person.
The actual formula for calculating the combined sound level of two sound sources is:
Lp = 10 log (10 x Lp1/10 + 10 x Lp2/10 )
There is a useful graph to show the extent to which a second sound source will increase the overall sound level (or not), which is shown in Fig. 2.
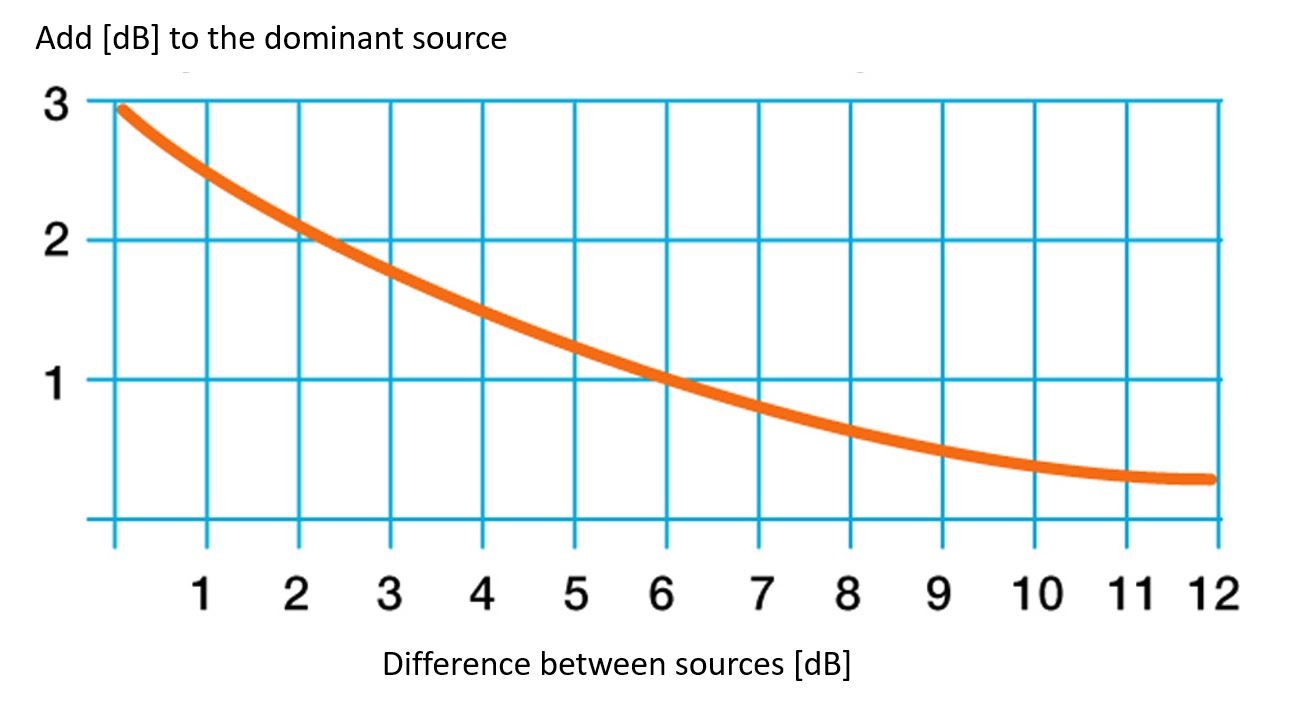
Fig. 2: Adding Sound Sources
Here you can see, for example, that if there are two sound sources, one at 80dB and one at 86dB, the combined sound level will be 87dB – because the difference of 6dB between the two sources adds just 1dB to the combined level.